(Auto)Stitching and Photo Mosaics
Part of CS180 : Intro to Computer Vision and Computational Photography
Introduction
In this project, I will be creating photo mosaics by stitching together multiple photos. In this first stage, we must manually define the correspondence points between the images, which will be used to calculate the homography matrix. This matrix will be used to warp the images into the same coordinate system, and then we can blend the images together to create a seamless mosaic. In the second part of the project, we will be using automatic correspondence to detect corner features in images, and then use these features to match images together. We will use RANSAC to find a good homography matrix, and then warp the images together to create a seamless mosaic.
One of my passions is photography and specifically computational photography, and as such, photo stitching is one of my favorite ways to capture a scene. I intended to solve one of my own grievances with the process in an extension to the project. ALthough I had many images I wanted to combine, I had to sort them all together in their own directory and name the resulting mosaic. Instead, I wanted to provide a directory of images that I had taken, and resolve which photos would match together and name them according the content in the pictures. To accomplish this, I used graphs to network a directory of images together and determine multiple mosaic roots, and then used the closeness centrality metric to determine the best root image for each, and used a image captioning model to create multiple named mosaics at once.
Manual Photo Stitching and Mosaics
In the first section of the project, I collected images that were suitable for photo mosaics from my collection. These photos were taken in different locations, but followed the same principle to keep the lens as fixed as possible and take multiple photos whilst rotating the camera. In this stage, we must manually define the correspondence points between the images, which will be used to calculate the homography matrix. This matrix will be used to warp the images into the same coordinate system, and then we can blend the images together to create a seamless mosaic.
Photos
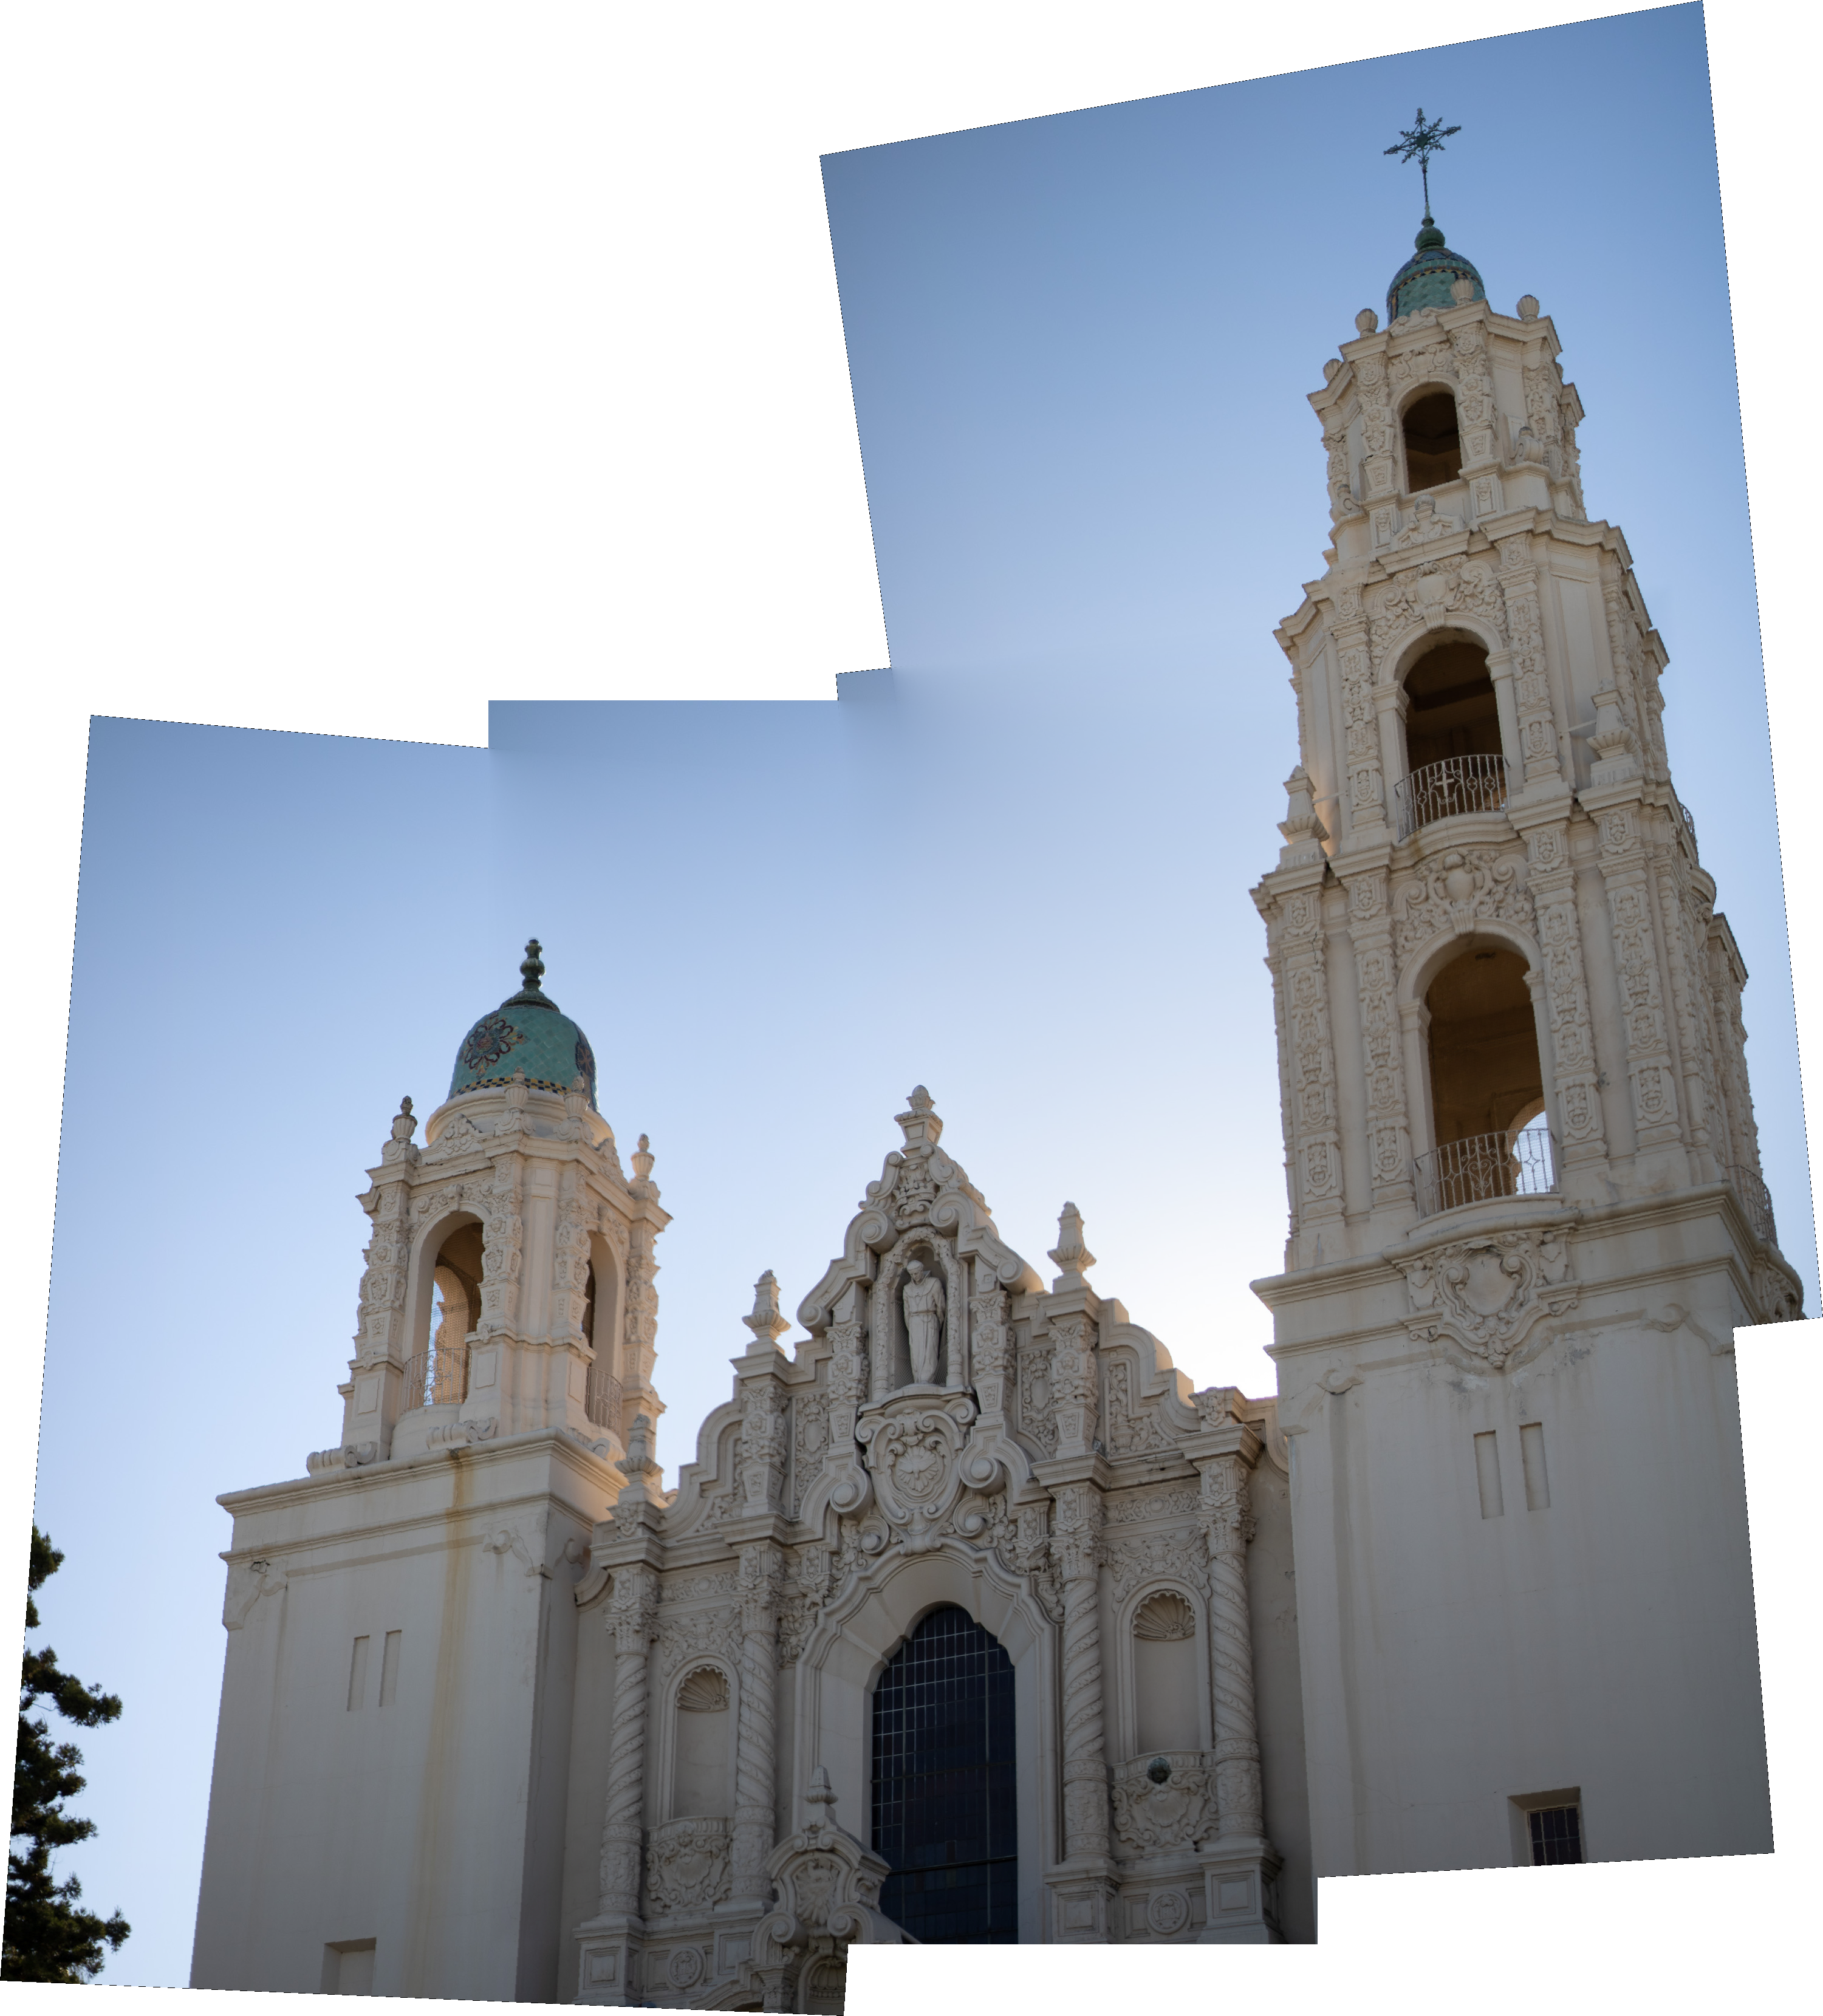
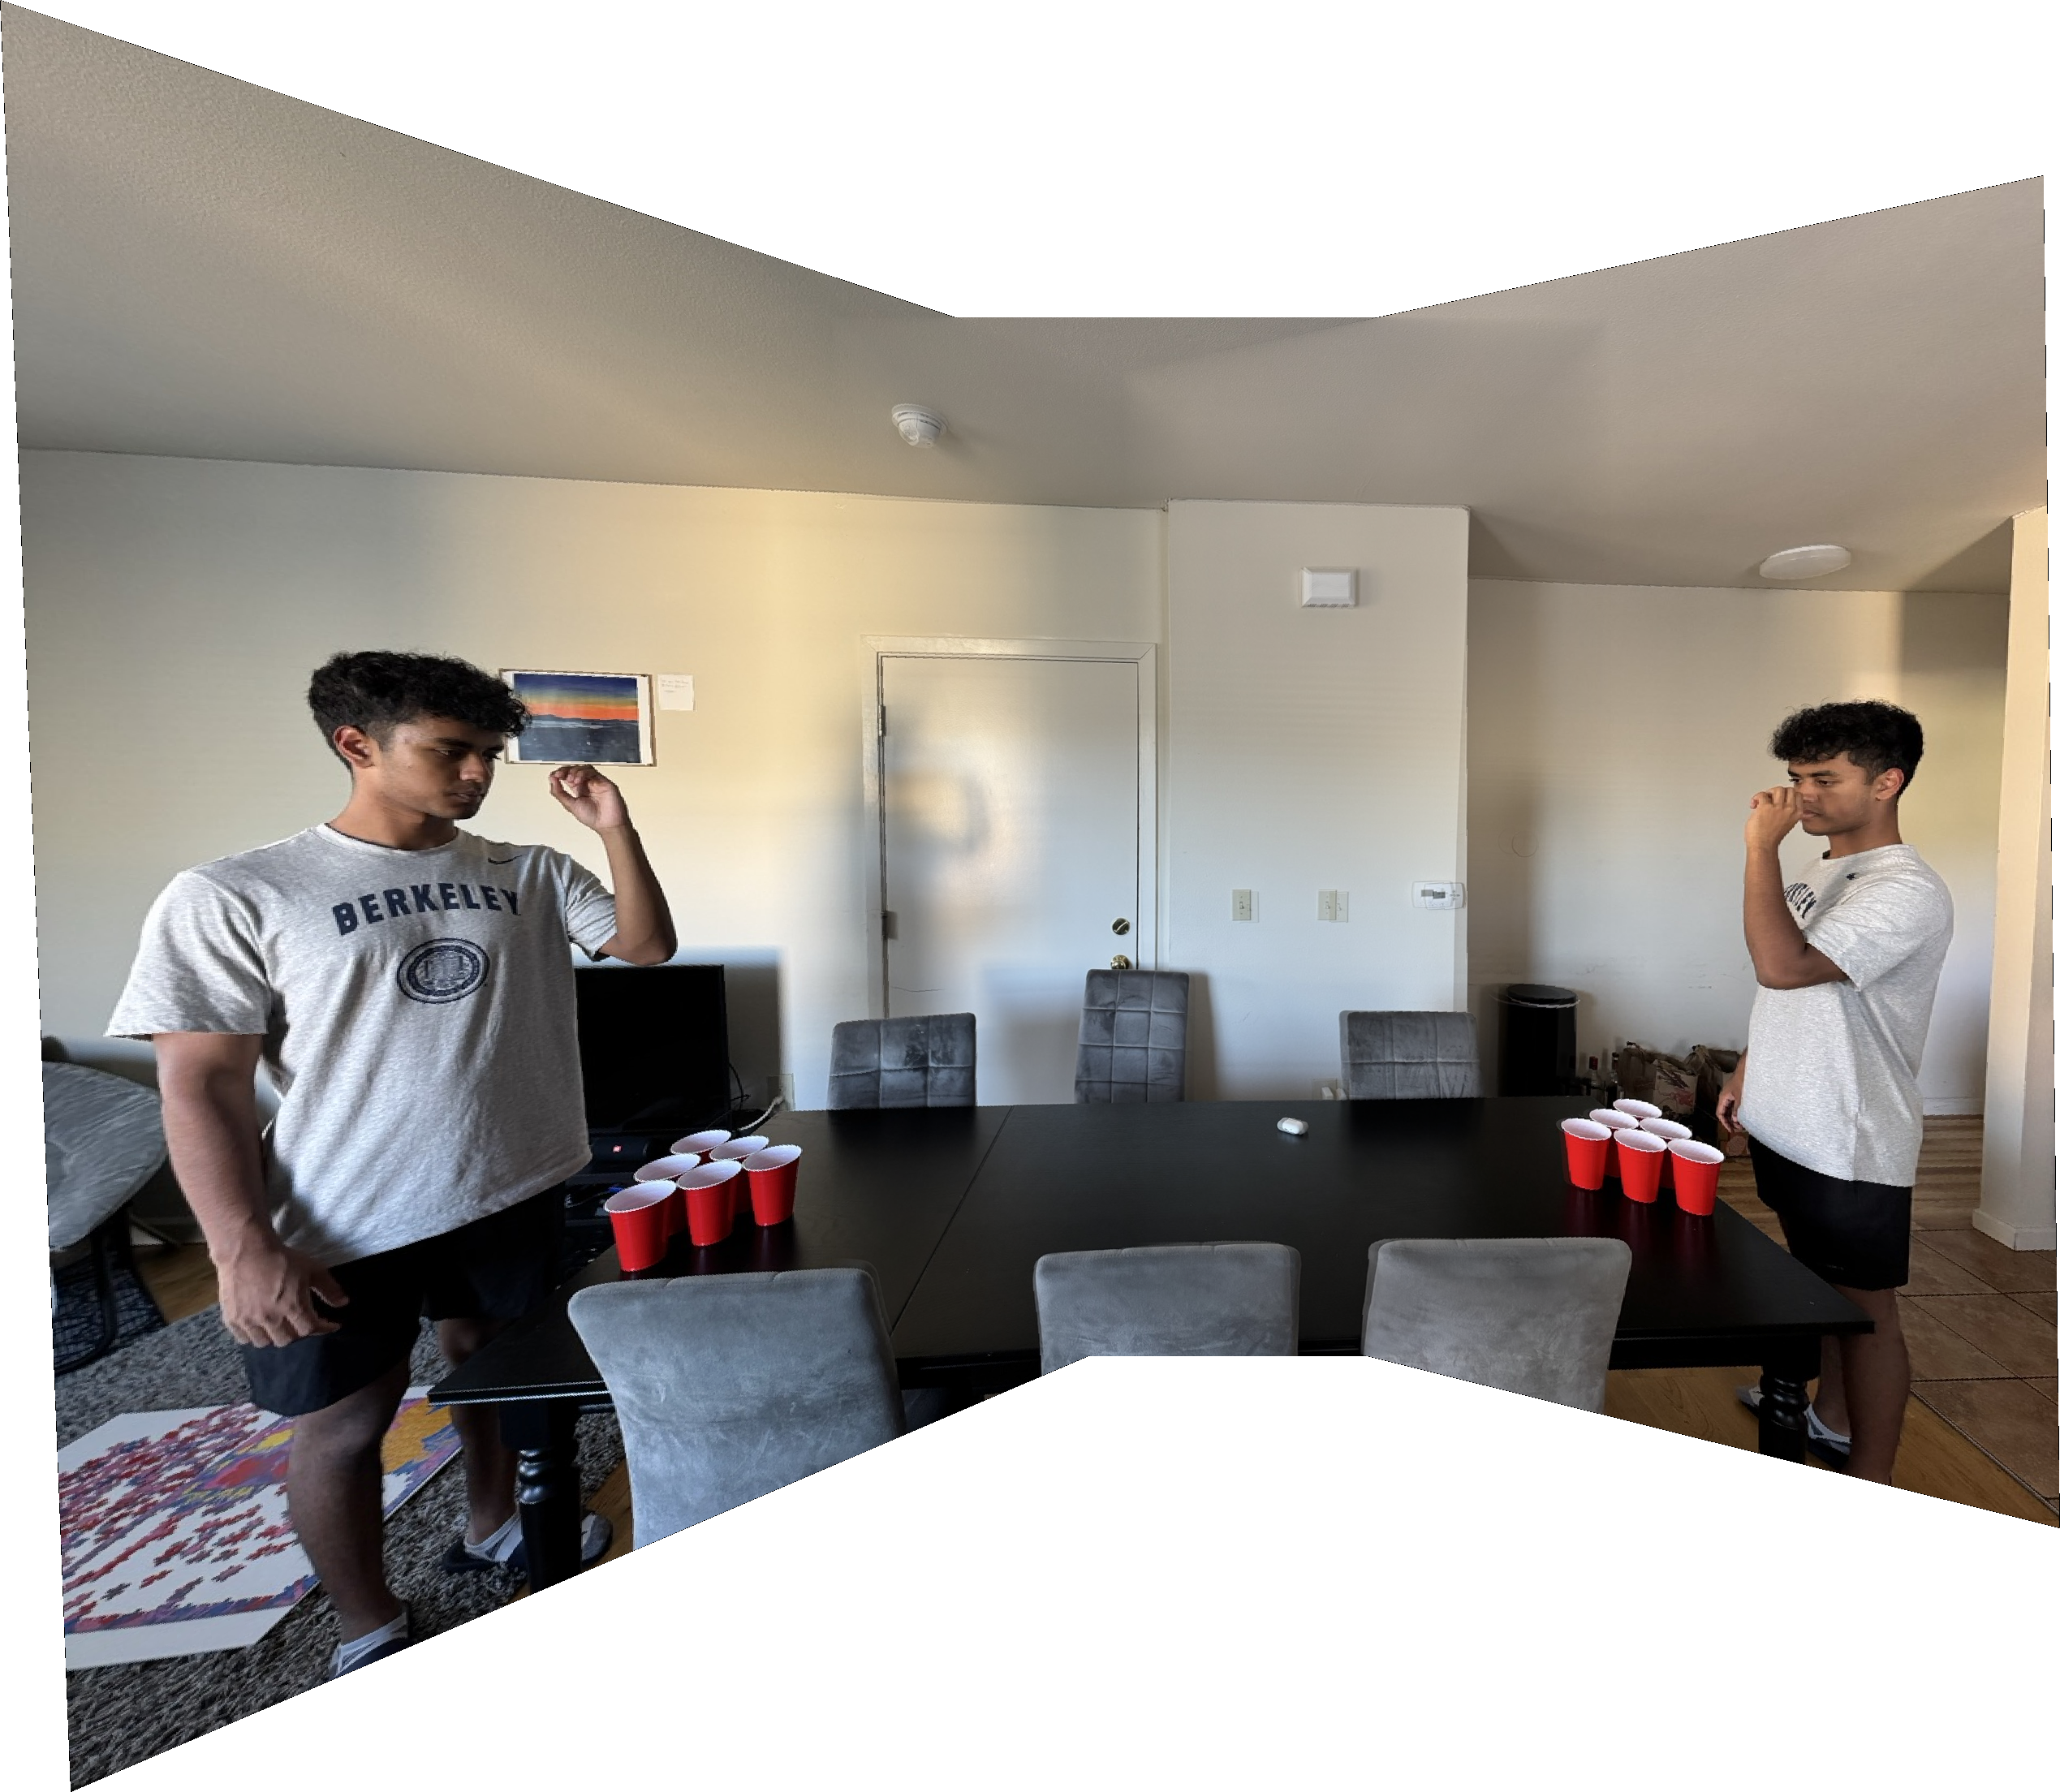
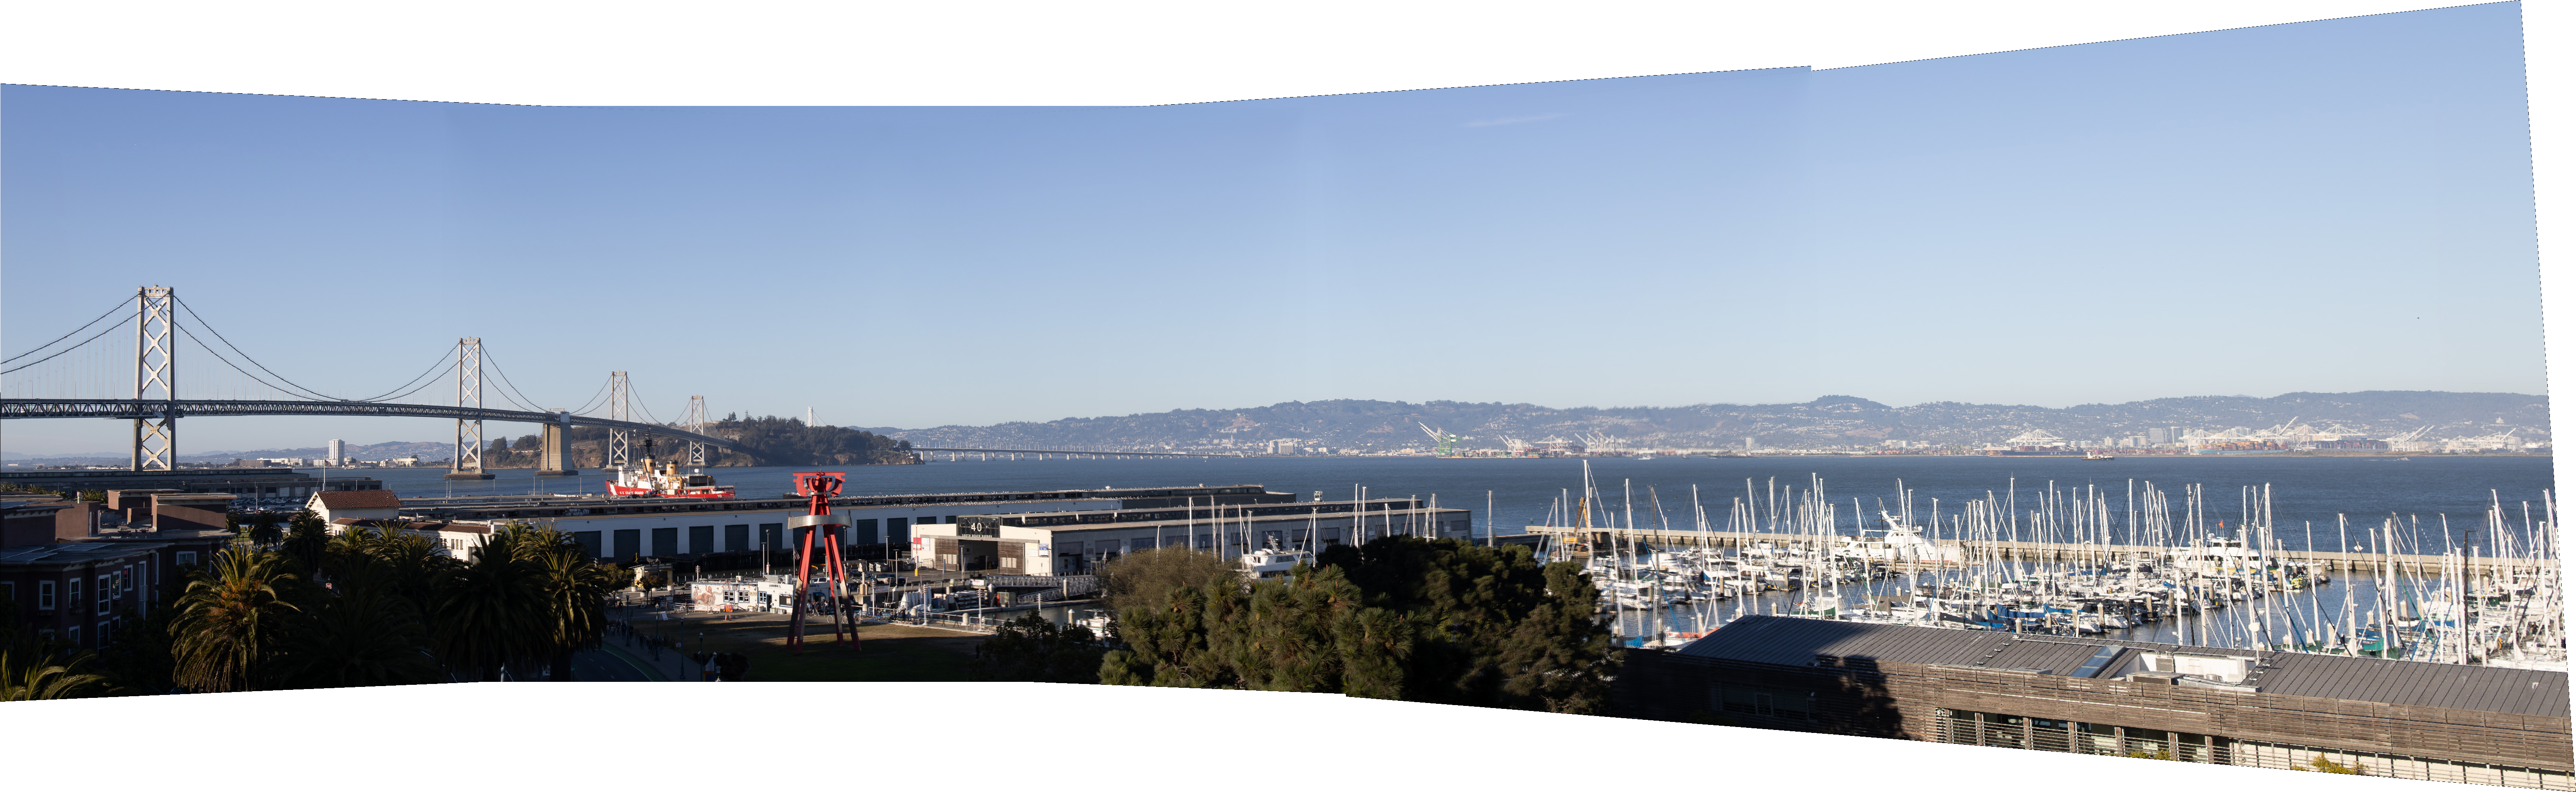
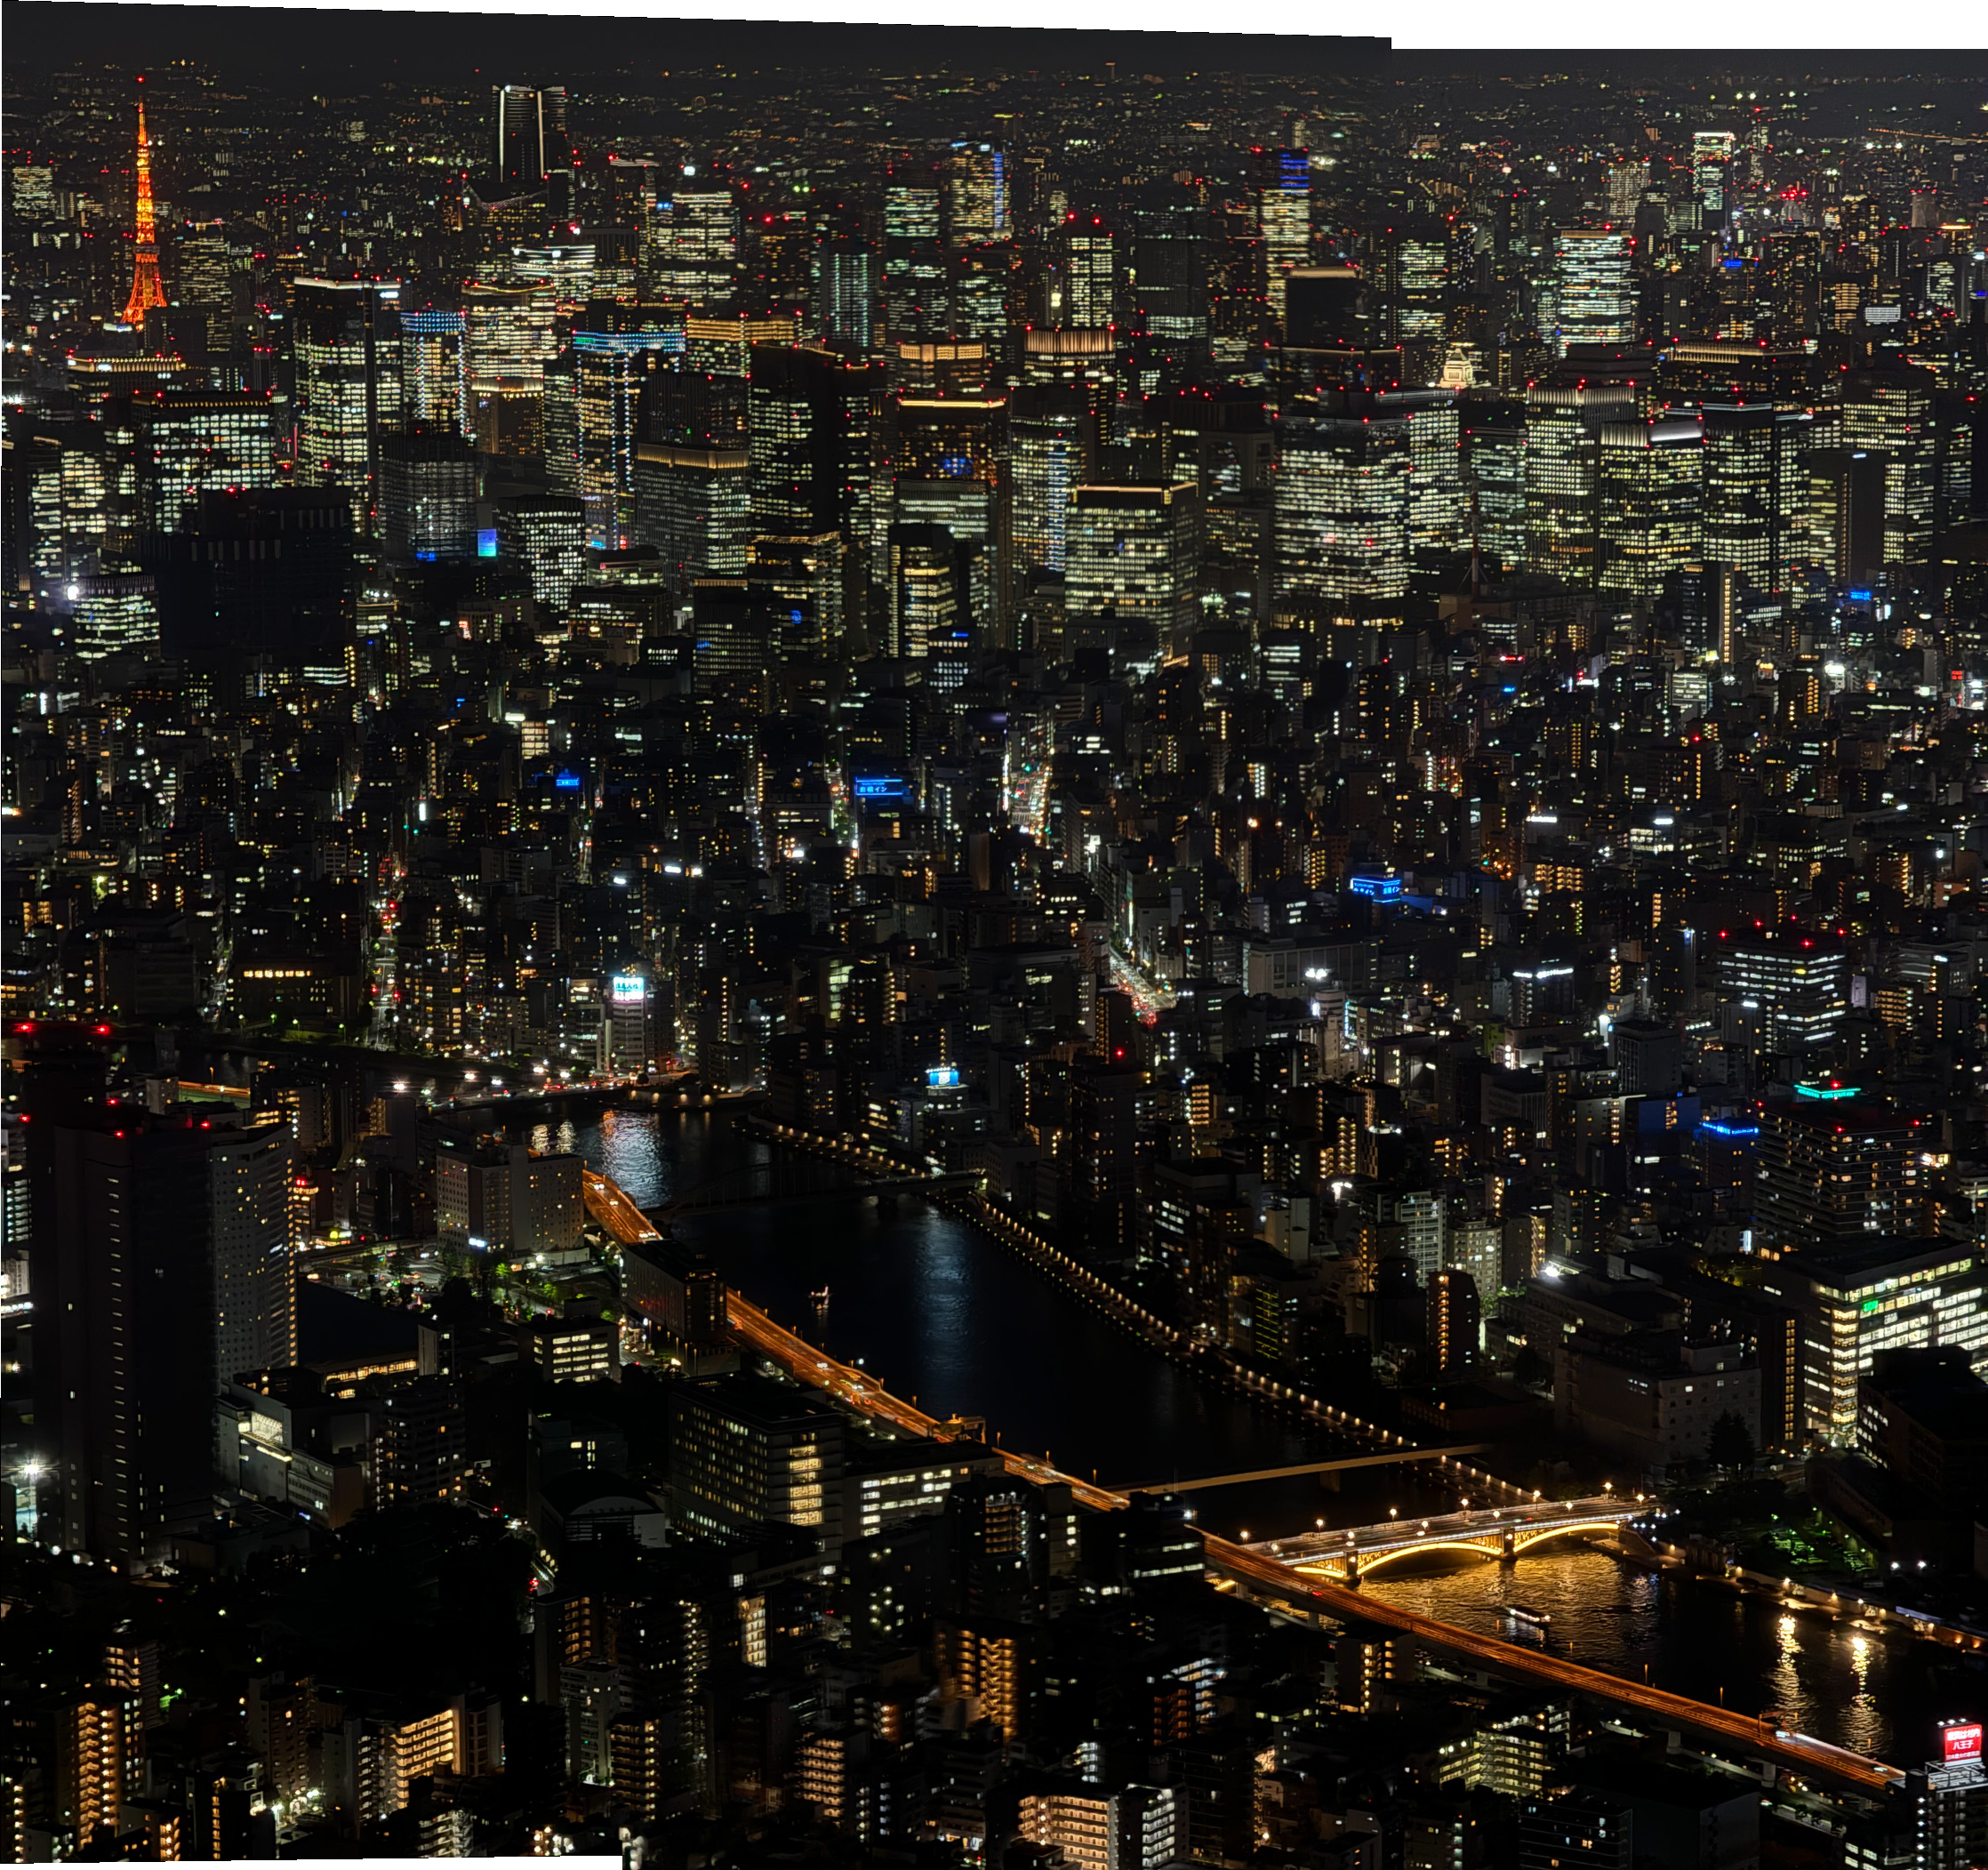
I decided to use photos that required photo stitching to present a narrative. These photos were taken such that not all of the subject was in the frame, and the camera was rotated to capture the entire subject. This was done to ensure that the photos could be stitched together to create a seamless mosaic. The first is a photo of Mission San Francisco, the second is a photo of my roommate in our living room playing pong, the third is a photo of the Bay Bridge, and the fourth is a photo of Tokyo Tower.
Mission San Francisco


Pong


Bay Bridge


Tokyo Tower


Recovering Homography
To stitch the photos, we first need to determine the relationship between them. This is done by calculating the homography, a 3x3 matrix that describes the transformation between two images. We compute the homography by using correspondence points between both images, manually (for now) marked locations that are the same between both images. By constructing a system of equations, we can solve for the homography matrix.
Because we are using projective geometry, we will set \(i = 1\), which enforces consistent scaling, and solve for the remaining 8 unknowns. To do so, we start by expanding the above equation:
We can now solve for the unknowns by constructing a system of equations. We can do this because our 3rd equation contains just w on the right side, meaning we can substitute the other two equations.
Now we can construct a matrix equation to solve for the unknowns:
With 8 unknowns, and 2 equations per correspondence point, we need at least 4 correspondence points to solve for the homography matrix. Using least squares, we can solve for the homography matrix with additional points to reduce errors from minor misalignments.
Here is an example of what the point correspondences used to calculate the homography matrix look like on the images:

Warping Images
Homography matrices are useful to warp all the points from one image to another. Going forward, we will refer to images in their own coordinate system, with the origin at the top left corner, as well as the mosaic coordinate system, which is a grid large enough to contain all images in their warped form. The mosaic coordinate system relies on the presence of a root image, which all other images will be warped to. In my implementation, I constructed a graph of where images were connected by their provided correspondence points, and used the closeness centrality metric to determine which image had the smallest distance to all other images. This image was then chosen as the root image.
For each image that would be warped, warp_im, I computed the shortest path to the root image, root_im. Then by traversing from warp_im to root_im, I could construct a homography matrix that would warp from warp_im, through the intermediary nodes, to root_im.
In the manual case, I was able to make decisions through the correspondences I provided on how images should warp to each other, for example avoiding warping through images that had little overlap, I would not have the benefit of this in the automatic case.
Once the homography matrices were computed, I could apply inverse warping from the pixels within the polygon that bounded the warp_im in the mosaic coordinate system, and interpolate the pixel values to fill in the mosaic image.
Results
Mission San Francisco


Pong


Bay Bridge


Tokyo Tower


Blending
Now that we can warp all images into a shared coordinate space, it is a good check to ensure that the images are correctly positioned atop each other at this point. If we simply change the alpha values and stack combine our images which live in a multi-dimension numpy array, we can see that our warping does work.

However, it is clear that simply overlaying the images will not suffice to create a mosaic. We need to blend the images together to create a seamless mosaic. To do this, we can use a simple linear blending technique. We can calculate the alpha value for each pixel in the mosaic image by taking the distance from the center of the image and dividing by the maximum distance from the center. This will create a gradient that we can use to blend the images together.
Mission San Francisco


Bay Bridge


I was able to greatly speed up this next step through the use of numpy vectorization, I started by stacking each image’s distance transform, and normalizing the values by channel (image-wise), this value would be interpreted as alpha values for the contribution of each image’s pixel in a weighted sum.
\[\text{alpha} = \frac{\text{d_tr} - \text{min}(\text{d_tr})}{\text{max}(\text{d_tr}) - \text{min}(\text{d_tr})}\]Then, we could perform a channel-wise weighted sum across both matrices to get the final mosaic image.
\[\text{mosaic} = \sum\_{i=1}^{n} \text{image}\_i \times \text{alpha}\_i\]Results
Rectification
The warping process can be used to rectify images as well. By using the homography matrix to warp the images, we can correct for perspective distortion. This is useful in cases where the camera is not perfectly aligned with the scene, and we want to correct for the distortion. The applications are truly boundless, but one scenario where it is useful is when you must take a picture of an important document, but you are unable to take it head-on. By taking a picture at an angle, the document will appear distorted, and non-legible. By using the homography matrix to warp the image, we can correct for this distortion and make the document legible.
We start by marking the corners of the document, and then the respective location in our new image where these corners should be. In rectification, this is often the corners of the new image, but it can be any location. We then calculate the homography matrix, and using this perform an inverse warp over our new image to fill in the pixels from the original image. Interpolation is extremely important here, as we are filling in pixels that may not have a direct correspondence in the original image.
Results
Someone left their secret password on the table, but I wasn’t able to get a good picture. Let us see if we can rectify the image to make it legible.
Secret Password


This example is quite notable because of the orientation of the document. The document was not only at a steep angle, but it was also not facing the camera. By correctly defining the corners of the document as relative to its orientation, it can be correctly projected into the new image and is now legible without having to mirror the text!
I took a picture of a fun Pikachu graphic, and I want to use it as my background! But the picture is at an angle, and I want to rectify it to make it straight.
Pokemon Graphic


</div>

Now I can use this as my background without having to worry about the image not being straight!
Automatic Correspondence
While manual correspondence is useful for small datasets, it is very time-consuming for larger datasets. In this section, we will explore how to automatically find correspondence points between images through Harris feature/corner detection, using the ANMS algorithm to select the best corners, making corner descriptors, and using these descriptors to find correspondence points between the images.
Detecting Corner Features
In this section, I started by computing a Harris matrix for our image, and chose the peaks with a limitation of a growing maximum in a region until we had a reasonable number of peaks. This was necessary to keep our values feasible for vectorization. I found around 45,000 to be the vectorization limit, and about 10,000 was a good compromise between speed and accuracy.


ANMS
We then used the ANMS, Adaptive Non-Maximal Suppression, algorithm to select the best corners. This function takes in our Harris matrix and list of peaks, and returns our top n corners. We start by computing a distance matrix between all peaks, I found that cdist from scipy was the fastest way to do this. I then extracted our top n harris values, and did a comparison between all elements with a robustness factor to determine if they should be suppressed by a stronger corner, this will be our robustness matrix. Next we mask our distance matrix using the robustness matrix, if the corner is sufficiently strong against another corner, we will keep it for consideration, otherwise we will suppress it right now by setting the distance to our image’s maximum distance. Now we can extract the minimum radius for each corner before it encounters a stronger corner, and keep the top n corners with the highest radius.
The robustness variable ultimately helps limit suppression, where a value of 1 enforces strict separation between points but loses some strong corners because they might be too close to each other. I was able to settle on a value of 0.9, which allowed for some overlap between points, but ensures that the strongest corners are kept.


Corner Features
We cannot compare our corner features between images in a 1-1 comparison because of aliasing that may cause the underlying pixels to be slightly different. Therefore, we can sample a 40x40 region around corners and downsample to 8x8 to get a descriptor for each corner. This makes the assumption that our images are already axis-aligned.


Next we normalize and standardize the pixel values of our descriptors, making them more robust to lighting changes and other factors.


Matches
Finally, when we compare the similarity between corners in two images, it is difficult to know whether there is a good agreement between the corners or if they simply match with many corners, therefore a good metric that helps us is the difference between a descriptor’ closest match and its second-closest match. If they are very close, the descriptor will not be helpful as it could have easily been another corner match. This helps determine if a match is good, filtering out bad matches.

RANSAC
Now that we have our corners, we want to find the homography matrix that best describes the relationship between the two images. However, we have many corners, and some of them may be outliers. To find the best homography matrix, we can use RANSAC, Random Sample Consensus, to iteratively find the best homography matrix. We start by randomly selecting 4 corners from our matches, and computing the homography matrix. We then find the number of inliers, corners that are within a certain threshold of the homography matrix, and keep the homography matrix with the most inliers. We repeat this process for a set number of iterations, and the homography matrix with the most inliers is our best homography matrix. This process is robust to outliers, as the probability of continously selecting all outliers is very low.


In my original automatic correspondence implementation, I limited my mosaics to size 2 as I didn’t have time to implement traversal across my graph network, however I returned to this feature in my next section.
Automatic End to End
In this extension, I wanted to automate the entire process of stitching images together. I began by changing the input to my program to be a directory of many images. I wanted my program to be able to determine which images should go together, and which were seperate. I additionally wanted them to be automatically named and outputted as mosaics.
Matching
With $n$ images, we need to determine which images should be stitched together. While there is likely a way to do this that is not $n^2$, I found that the time complexity was not a concern for the number of images I was working with. I started by computing the matches between all images, as described in the previous section. However, I found that only if the number of matches exceeded 6 should the images be considered for stitching. This was because some images contained few generic enough features that they could be matched with many other images, and this was not a good indicator of a good match. I wanted to determine a better metric for grouping images together, such as distance to group roots, but I could not find a good way to implement this, and my hard-coded solution was sufficiently working.
Homography Network
#Compute number of samples to get 99% confidence
confidence = 0.99
match_confidence = 0.1
prob_4_correct = (match_confidence) ** 4
num_samples = int(np.log(1 - confidence) / np.log(1 - prob_4_correct))
#Number of samples for 95% confidence: 46049
I originally computed the number of samples needed for 99% confidence between two images, but this was too when running on a large group of images. I likely assumed the chance for a correct match was too low, but experimentally I found 10000 samples to be sufficient to get a good homography matrix. However, because of the large number of ways an image could now traverse our homography graph to get to the root, I needed a better way to quantify the quality of the homography matrix than just the number of inliers.
homography_matrix, inliers = ransac_homography(matches, self.corners[image_path1], self.corners[image_path2], threshold=2.0, max_iterations=10000)
real_inliers = len(inliers) - 4
real_challengers = len(matches) - 4
quality = (real_inliers / real_challengers) * (1 - np.e ** (-real_challengers / 20))
I used the real inliers versus the number of challengers to determine the quality of the homography matrix. However, I found that a simple ratio was not enough, consider the case in which there are only a few real challengers, 10, and the homography matrix could easily be considered perfect even if these 10 managed to be within bounds, or close with 9. Alternatively, having 200 real challengers and sufficiently matching 180~190 of them is much more challenging, and therefore a sign of a better homography matrix. To mathematically represent this, I used the exponential decay to penalize the homography matrix for not having enough real challengers, and multiplied this by the ratio of real inliers to real challengers to get a quality metric. With our quality metric being bounded between 0 and 1, we can simply subtract 1 from it to obtain an error metric, and minimize the error throughout our traversal. While I implemented a cummulative error metric, it is likely that a compounding error metric would have been more effective in an intensive traversal due to the compounding nature of errors.
Naming
With our images grouped and formed into mosaics, it became a challenge on how to output them. While I could have chosen to use the name of the root image, I wanted to give them a better name. To do so, I used Salesforce/blip-image-captioning-large to generate captions, however these were not quite good enough to directly use as names, so I developed a filter to remove words from the generated captions.
I then tested my naming algorithm on a few images:


See if you can guess which caption corresponds to which image!
Original caption: a panoramic image of a busy city street with fireworks in the sky
Cleaned caption: busy city street with fireworks in the sky
Original caption: a panoramic image of a very tall building with a clock on it
Cleaned caption: tall building with a clock on it
Original caption: a panoramic image of a busy city street with fireworks in the sky
Cleaned caption: busy city street with fireworks in the sky
Original caption: a panoramic image of a busy city street at night with fireworks
Cleaned caption: busy city street at night with fireworks
Original caption: a panoramic image of a wall full of beer bottles
Cleaned caption: wall full of beer bottles
Original caption: a panoramic image of a rainbow painted street in a city
Cleaned caption: rainbow painted street in a city
Original caption: a panoramic image of a stadium lit up at night
Cleaned caption: stadium lit up at night
Original caption: a panoramic image of an aerial view of a city and a lake
Cleaned caption: aerial view of a city and a lake
Original caption: a panoramic image of a group of people posing for a picture
Cleaned caption: group of people posing for a picture
Results
Starting first with a small dataset of 27 images, I was able to successfully stitch together the images into 5 mosaics.
Vacation Directory


Vacation Output


Stress Test Directory


Stress Test Output
